
All about the Heikin Ashi
Added 11.04.2023What Is Heikin Ashi?
Heikin Ashi is a type of candlestick charting technique used in technical analysis of financial markets. It is a Japanese term that translates to "average bar," and it is used to smooth out the price action of a security and help identify trends more easily. In traditional candlestick charts, each candlestick represents a single period of time, such as a day or an hour. However, Heikin Ashi candlesticks are calculated based on the average price of the previous period, which can help to filter out some of the noise and make it easier to identify trends. Heikin Ashi candlesticks are constructed using a modified formula that takes into account the open, high, low, and close of the previous period. The resulting candlesticks can often look different from traditional candlesticks, with smaller bodies and longer wicks, but they provide valuable information about the market's direction and momentum. Traders often use Heikin Ashi charts in combination with other technical analysis tools to make trading decisions.
Formula
The Heikin Ashi formula is based on the previous period's open, high, low, and close values, as follows:
- Heikin Ashi Close = (Open + High + Low + Close) / 4
- Heikin Ashi Open = (Previous Heikin Ashi Open + Previous Heikin Ashi Close) / 2
- Heikin Ashi High = Maximum of High, Heikin Ashi Open, or Heikin Ashi Close
- Heikin Ashi Low = Minimum of Low, Heikin Ashi Open, or Heikin Ashi Close
The first Heikin Ashi candlestick is calculated based on the regular candlestick values for the first period. Each subsequent Heikin Ashi candlestick is calculated using the previous Heikin Ashi candlestick values.
By using these modified values, the Heikin Ashi chart can provide a smoother representation of the price action, making it easier to identify trends and changes in momentum.
How To Read
Heikin Ashi candles can be read in a similar way to traditional candlestick charts, but with some key differences due to their modified formula. Here are some tips on how to read Heikin Ashi candles:
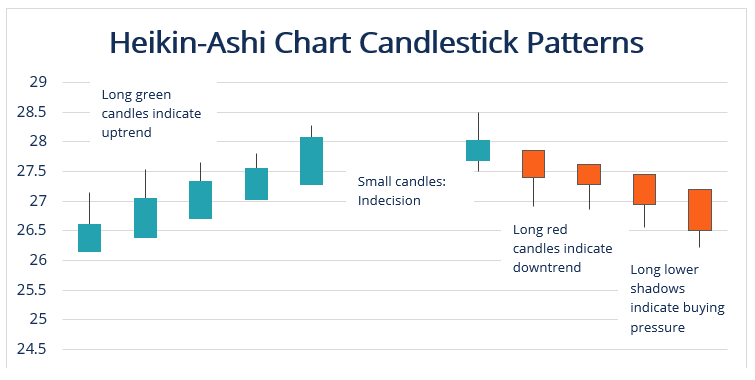
- Trend: The trend can be determined by the color of the candles. A bullish trend is indicated by green candles, while a bearish trend is indicated by red candles.
- Body size: The size of the body can indicate the strength of the trend. Larger bodies indicate a stronger trend, while smaller bodies indicate a weaker trend.
- Wick length: The length of the wicks can indicate the market's volatility. Longer wicks suggest greater volatility, while shorter wicks suggest lower volatility.
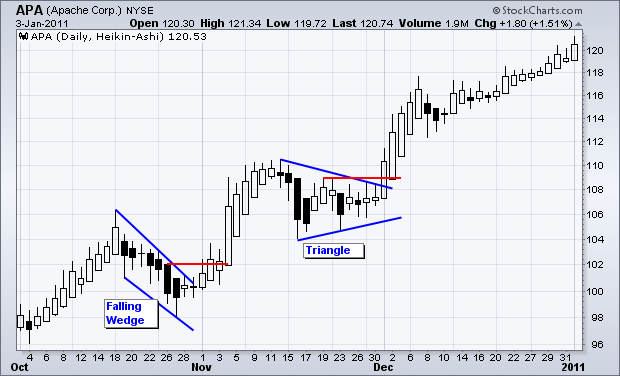
- Support and resistance levels: Support and resistance levels can be identified by looking for areas where the price has repeatedly touched or bounced off of the Heikin Ashi candles.
- Reversal patterns: Just like with traditional candlestick charts, Heikin Ashi candles can form reversal patterns such as doji or engulfing patterns, which can signal potential trend reversals.
Constructing the Chart
To construct a Heikin Ashi chart, you can follow these steps:
- Start with a regular candlestick chart for the desired time period (e.g. daily, hourly, etc.).
- Calculate the Heikin Ashi candlestick values using the formula described earlier for each period.
- Replace each regular candlestick on the chart with a Heikin Ashi candlestick using the calculated values.
- Repeat the process for each subsequent period to create a complete Heikin Ashi chart.
Many trading platforms and charting software have built-in tools to create Heikin Ashi charts, so you don't need to manually calculate the values yourself.
You can build a graph yourself using python and the libraries yfinance and mpl_finance.
Trading Strategy Explained
Here is a simple Heikin Ashi trading strategy that you could use:
- Identify the trend: Look for a series of at least three consecutive Heikin Ashi candles of the same color to indicate a trend. A series of green candles indicates an uptrend, while a series of red candles indicates a downtrend.
- Enter the trade: Once you have identified a trend, wait for a pullback in the opposite direction of the trend. When the trend resumes, enter a trade in the direction of the trend.
- Set stop-loss and take-profit levels: Use technical analysis tools such as support and resistance levels, moving averages, or Fibonacci retracements to determine where to set your stop-loss and take-profit levels. Be sure to practice proper risk management techniques and adjust your position size accordingly.
- Exit the trade: Once the price reaches your take-profit or stop-loss level, exit the trade. Alternatively, you could also use trailing stop-loss orders to lock in profits as the trend continues.
This is just one example of a Heikin Ashi trading strategy, and there are many other approaches that traders may use depending on their trading style and risk tolerance. As with any trading strategy, it's important to thoroughly test and backtest your approach before using it with real money, and to continuously monitor and adjust your strategy as market conditions change.
Indicator Signals
The Heikin Ashi indicator can provide signals that traders can use to make trading decisions. Here are some of the most common signals that traders look for:
- Trend confirmation: A series of consecutive green or red Heikin Ashi candles can indicate a bullish or bearish trend, respectively. Traders may use these signals to confirm the direction of the trend before entering a trade.
- Trend reversal: A change in color from green to red or from red to green can indicate a potential trend reversal. Traders may use these signals to exit a trade or to enter a trade in the opposite direction of the previous trend.
- Support and resistance levels: Areas where the price has repeatedly touched or bounced off of the Heikin Ashi candles can indicate support or resistance levels. Traders may use these levels to set stop-loss and take-profit orders or to enter trades when the price breaks through these levels.
- Candlestick patterns: Heikin Ashi candles can form traditional candlestick patterns such as doji, hammers, and shooting stars. Traders may use these patterns to identify potential trend reversals or to confirm the direction of the trend.
- Momentum: The length of the wicks on the Heikin Ashi candles can indicate the market's volatility and momentum. Longer wicks can indicate a potential trend reversal, while shorter wicks can indicate a continuation of the trend.
Heikin Ashi vs Candlestick
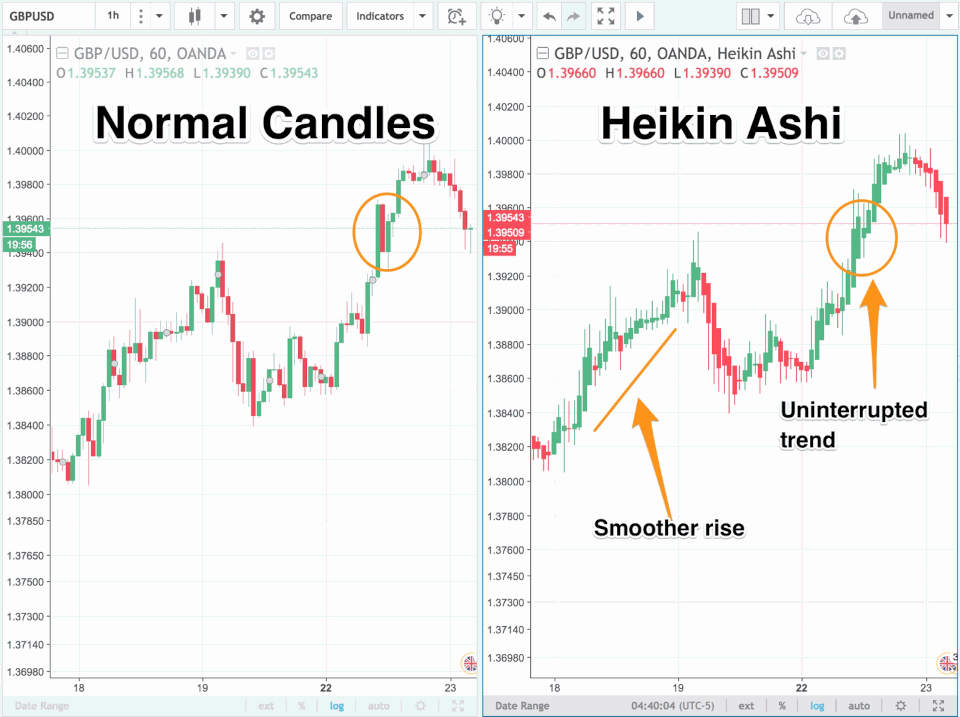
The main difference between Heikin Ashi and candlestick charts is the way they represent price movements. Candlestick charts show the open, high, low, and close prices for each period, while Heikin Ashi charts use a modified formula to represent the average price movements.
Here are some of the main differences between Heikin Ashi and candlestick charts:
- Candle color: In traditional candlestick charts, the color of the candlestick depends on whether the close price was higher or lower than the open price. In Heikin Ashi charts, the color of the candlestick depends on whether the current average price is higher or lower than the previous average price.
- Smoothed price movements: Heikin Ashi charts use a modified formula to smooth out price movements and eliminate noise. This can make it easier to identify trends and support and resistance levels.
- Price gaps: In traditional candlestick charts, price gaps can occur when the open price of one period is significantly different from the close price of the previous period. Heikin Ashi charts, on the other hand, smooth out these gaps by using the average price movements.
- Volatility: Heikin Ashi charts can provide a clearer view of market volatility by taking into account the average price movements rather than the actual price movements.
In general, Heikin Ashi charts can be useful for traders who prefer a smoother representation of price movements and want to identify trends more easily.
Candlestick charts, on the other hand, can be useful for traders who prefer a more detailed view of price movements and want to identify specific price patterns and levels more easily. Ultimately, the choice between Heikin Ashi and candlestick charts comes down to personal preference and trading style.
Pros And Cons
Heikin Ashi charts have several advantages and disadvantages that traders should consider before using them in their analysis. Here are some of the main pros and cons of Heikin Ashi charts:
Pros:
- Smoothed price movements: Heikin Ashi charts use a modified formula to smooth out price movements and eliminate noise, making it easier to identify trends and support and resistance levels.
- Clearer view of trends: The modified formula used in Heikin Ashi charts can help filter out market noise, providing traders with a clearer view of the trend direction.
- Better risk management: The smoother price movements in Heikin Ashi charts can make it easier to identify stop-loss and take-profit levels, helping traders manage risk more effectively.
- Combines well with other technical indicators: Heikin Ashi charts can be used in combination with other technical indicators such as moving averages and RSI to provide a more complete picture of the market.
Cons:
- Delayed signals: The smoothing effect of the Heikin Ashi formula can result in delayed signals, meaning traders may miss out on some trading opportunities.
- Price gaps: Heikin Ashi charts smooth out price gaps, which can lead to inaccurate price movements and false signals.
- Not suitable for all markets: The Heikin Ashi formula is most effective in trending markets, and may not work as well in choppy or range-bound markets.
- Different from traditional candlestick charts: Heikin Ashi charts can look quite different from traditional candlestick charts, which can take some time to get used to.