
Introducing Animated Pie Charts: A Dynamic Way to Visualize Your Data
Added 21.11.2023In the ever-evolving world of data visualization, LivingCharts.com is excited to introduce a new and dynamic way to present your data: the Animated Pie Chart, also known as an animated pie graph. This innovative approach combines the clarity of traditional pie charts and the appeal of donut chart animation with the engaging and informative power of animation, making your data not just seen, but experienced.
What is an Animated Pie Chart?
An Animated Pie Chart is a graphical representation that brings your data to life. Unlike static pie charts, the animated version showcases data changes over time, revealing trends and patterns in a more interactive and visually appealing manner. This type of chart animates the transition between data states, adding a temporal dimension that provides deeper insights into how data segments grow, shrink, or change over time.
Benefits of Using Animated Pie Charts:
- Enhanced Engagement: The animation, akin to donut chart animation, captures attention, making your data more engaging for the audience.
- Improved Comprehension: By showing data transitions, viewers can better understand the dynamics of the data.
- Effective Storytelling: Animated pie charts can tell a compelling story about your data, highlighting key changes and trends.
- Versatility: Suitable for various data types, from financial figures to survey results.
When to Use Animated Pie Charts:
- Illustrating Data Over Time: Ideal for showing how different segments of your data have evolved over a period.
- Comparing Changes in Proportions: Useful when you want to highlight how the relative sizes of different categories have shifted.
- Presenting Periodic Reports: Great for quarterly financial reports, survey results, or any regular data updates.
- Making Presentations More Dynamic: To add a visual punch to your presentations, making them more memorable and impactful.
- Simplifying Complex Data: When you need to simplify complex data into an easily digestible format.
Conclusion and Example:
The Animated Pie Chart is a game-changer for data visualization. By bringing data to life, it not only makes information more accessible but also turns it into a captivating narrative. At LivingCharts.com, we are committed to providing innovative solutions for your data presentation needs, and the Animated Pie Chart is just the beginning. Explore this new feature and see how it can transform your data storytelling.
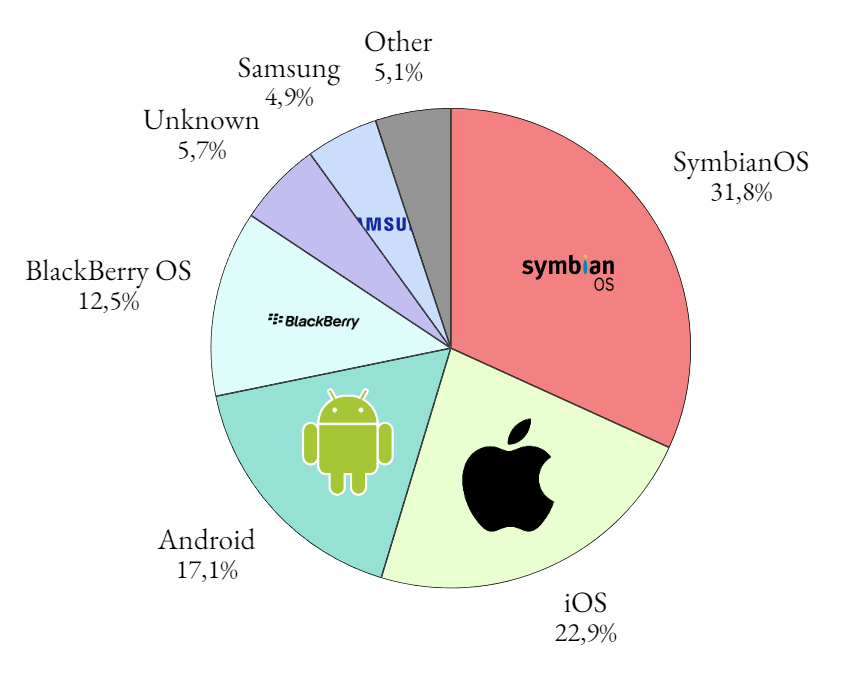
See an example animation: