

LivingCharts vs Flourish: Which Is Better for Bar Chart Race Videos?
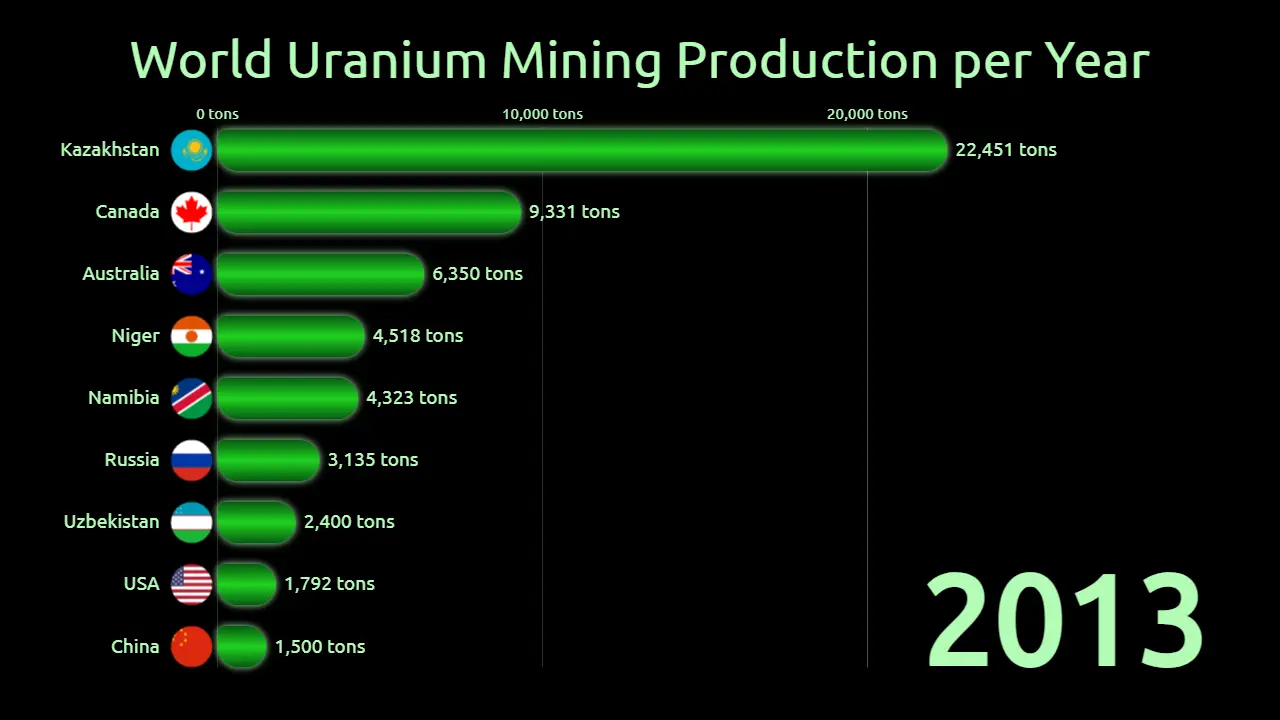
Choose LivingCharts if your main goal is creating and exporting animated ranking videos quickly.
Bar chart races are everywhere on YouTube and TikTok: countries racing by GDP, brands fighting for market share, sports stats climbing the ranks. Two popular tools for making them are LivingCharts and Flourish. Both let you build races without code, but they are built for different end goals.
Flourish is a broad interactive visualization platform. LivingCharts is built around animated charts you can customize and export as video. Below is a focused comparison on five things that matter most when your output is a publishable race video.
1. Ease of use
LivingCharts is optimized for a short path: import data, tweak the race, and export video. You work in the browser, change settings, and preview the animation immediately. There is no story builder or multi-template decision tree between you and a finished clip.
Flourish is also beginner-friendly for bar chart races. Its dedicated race template is polished, and the editor is clear. The catch for video creators is workflow length: a strong interactive race is easy, but exporting it natively as an MP4 requires adding the visualization to a Flourish Story and using the premium video export feature. Flourish also suggests recording a video or GIF as an alternative. See the official Flourish Bar Chart Race documentation and video export guide.
Verdict: For “data in, race video out,” LivingCharts feels faster. Flourish is easy too if your main goal is an interactive embed, not a finished video file.
2. Customization
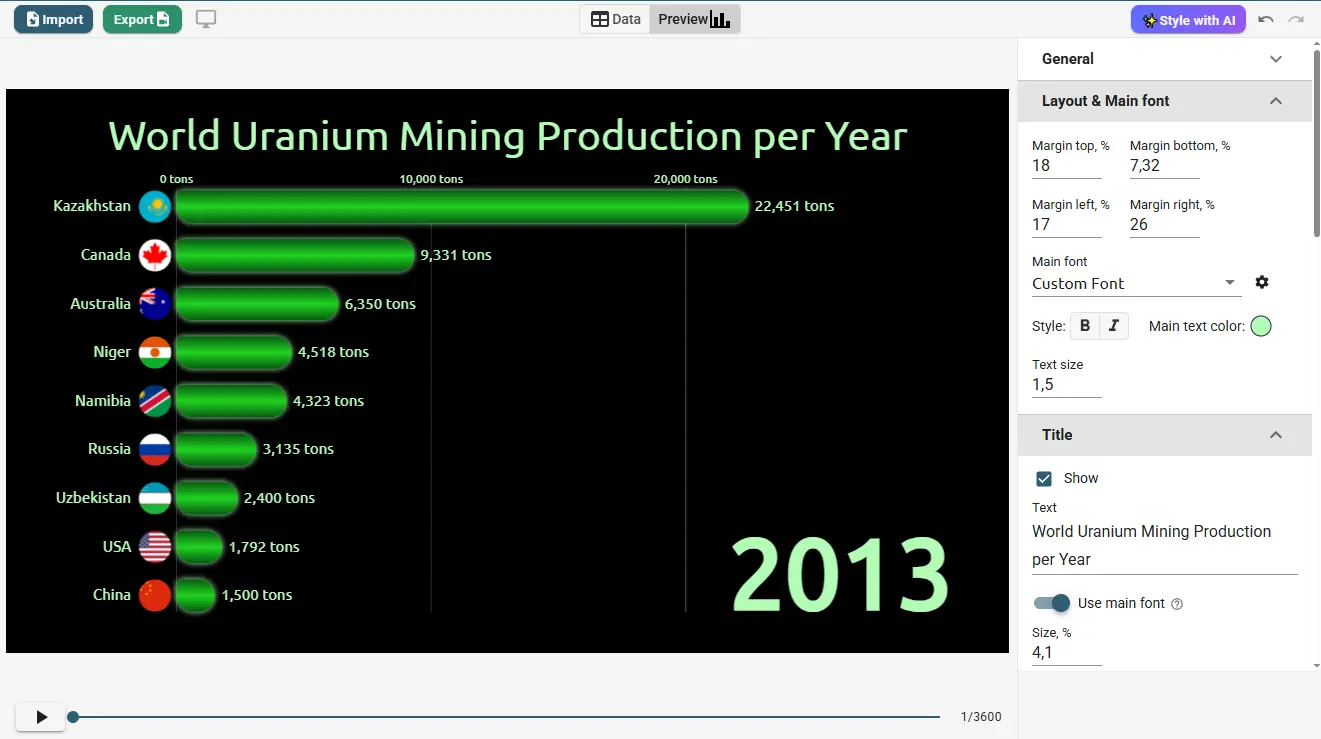
LivingCharts leans into deep visual control for race videos: colors, labels, timing, fonts, layout, and other animation-focused settings. The product positioning is explicit: charts meant to look distinct on camera, not like a default template.
Flourish also offers extensive template-level controls for bar chart races, including colors, bar height, label positioning, maximum visible series, sorting, speed, and animation settings. Its paid plans additionally offer branding features such as custom themes, colors, logos, and fonts. You can review these options in Flourish’s official Bar Chart Race overview and pricing and feature comparison.
Verdict: Both are customizable. LivingCharts is stronger if you care about making this race video look unique. Flourish is stronger if you need brand systems across a wide visualization toolkit.
For video-first content, visual customization matters: colors, timing, labels, fonts, and layout all affect watchability.
3. Video export
This is the biggest practical difference.
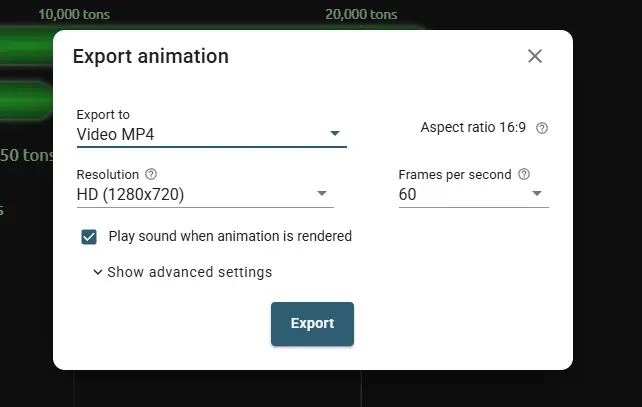
LivingCharts treats video as a first-class output. You can export animation directly to MP4, and also use image sequences or embed code. Video export is part of the core product, including on the free Basic tier, with free-plan limits such as ads or watermark depending on plan.
Flourish is primarily built for interactive publishing. According to Flourish’s official documentation, its video export feature downloads Flourish Stories as MP4, is a premium feature, and must be enabled by the Flourish team for eligible Enterprise customers. Standalone visualizations must first be added to a Story before they can be exported as video. Flourish’s current pricing table lists video export under the Enterprise plan, while Presenter includes image/SVG export and Publisher adds HTML export. See Flourish’s official video export guide and Flourish pricing.
Verdict: For bar chart race videos, LivingCharts wins clearly. Flourish wins if you mainly need interactive embeds and only occasionally need a clip.
4. Pricing
LivingCharts uses transparent self-serve plans:
- Basic — free starter tier with project limits; includes file import and export to images, video, and embed.
- Pro — unlimited projects, no ads, no watermark, and private projects.
- Business — advanced customization, including own fonts, teams, and priority support.
You can start exporting videos without a sales call.
Flourish pricing is oriented around interactive publishing and organization needs:
- Free — unlimited projects, access to templates, and public publishing and embedding with attribution.
- Presenter — available through Canva Business or Enterprise and includes image and SVG export.
- Publisher — sales-based plan that adds HTML export, team features, scrollytelling, and custom branding.
- Enterprise — sales-based plan with advanced security, branding, support, and video export listed among the available export options.
You can verify the current plan differences directly on the official Flourish pricing page.
For creators who only need race videos, Flourish’s native MP4 path sits at the top, and least self-serve, end of the plan ladder.
Verdict: LivingCharts is usually more cost-accessible for video-first creators. Flourish can be excellent value for newsrooms and teams shipping interactive graphics at scale, but native video export is gated higher.
5. Compatibility with YouTube and TikTok
LivingCharts supports common social aspect ratios, including 16:9 for YouTube, 1:1 for square social posts, and 9:16 for TikTok, Reels, and Shorts. Combined with direct MP4 export, that makes it straightforward to render once and upload.
Flourish graphics are responsive and look great in browsers. For users with access to video export, Flourish allows Story videos to be rendered at Full HD 1920×1080 and also supports custom dimensions. Its documentation specifically mentions vertical formats such as 1080×1920 for TikTok. See the official Flourish video export documentation.
Flourish also has attribution requirements that vary by plan and publishing method. Its Bar Chart Race documentation states that users outside paid plans must include a link back to the Flourish homepage when publishing or embedding videos or GIFs made with Flourish. See the official Bar Chart Race publishing guidance.
Verdict: LivingCharts is better aligned with YouTube and TikTok upload workflows. Flourish can reach those platforms, but the cleanest native video path requires access to its premium video export workflow.

Bottom line
| Criteria | Better for race videos |
|---|---|
| Ease of use | LivingCharts — shorter path to a finished clip |
| Customization | Tie — LivingCharts for race-video polish; Flourish for broad branded visualization systems |
| Video export | LivingCharts |
| Pricing | LivingCharts for self-serve video creators |
| YouTube / TikTok | LivingCharts |
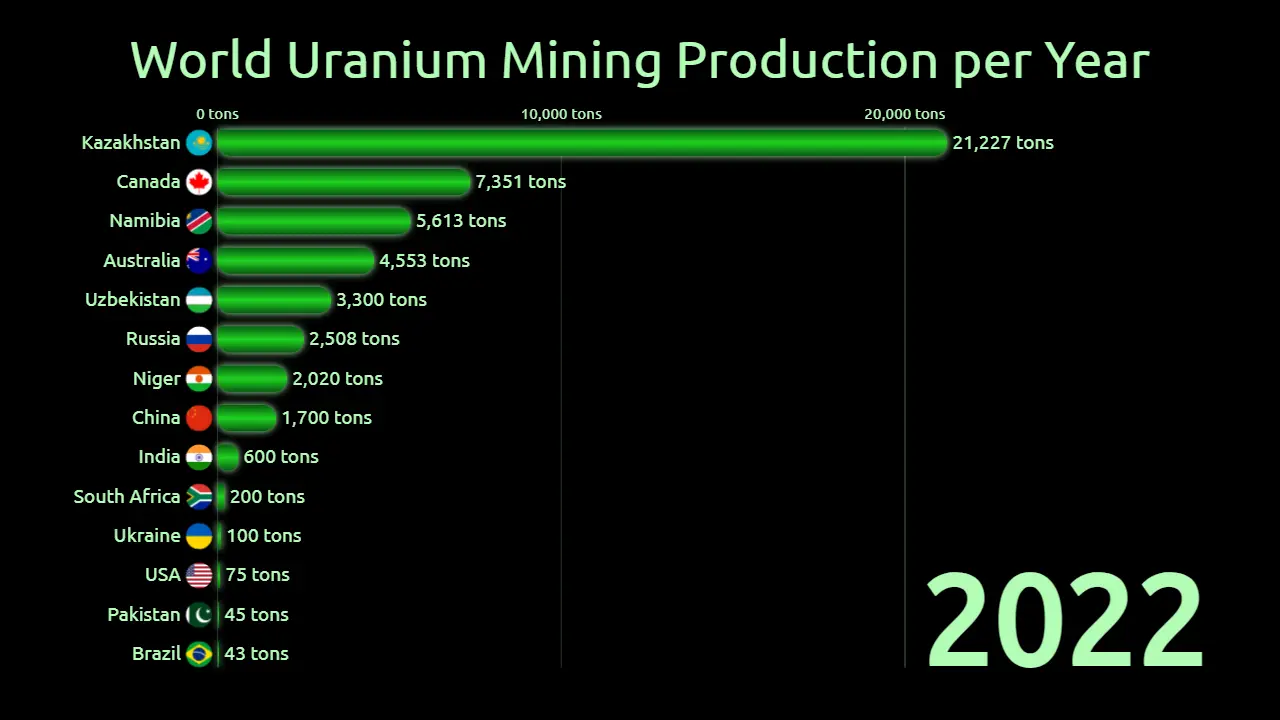
Choose LivingCharts if you want to make ranking race videos fast, export MP4s, and post to YouTube or TikTok without enterprise gates or screen-recording workarounds.
Choose Flourish if your priority is interactive data storytelling for web, presentations, or Canva, and video is secondary.
For creators whose success metric is “upload a bar chart race this afternoon,” LivingCharts is the better fit.