
3 Steps to Effectively Visualize Survey Data
Added 22.03.2023Step 1 – Select the Type of Visualization and Tool: 7 Best Choices
Survey data can provide valuable insights into a wide range of topics, from consumer preferences to employee satisfaction. However, the effectiveness of survey data analysis is largely determined by the ability to visualize and communicate key findings in a clear and compelling manner.
Bar Charts
Bar charts are a simple yet effective way to visualize survey data. They are ideal for comparing the responses of different groups or categories. For example, a bar chart can be used to compare the responses of male and female participants to a particular question. Bar charts can also be used to show the distribution of responses to a particular question.
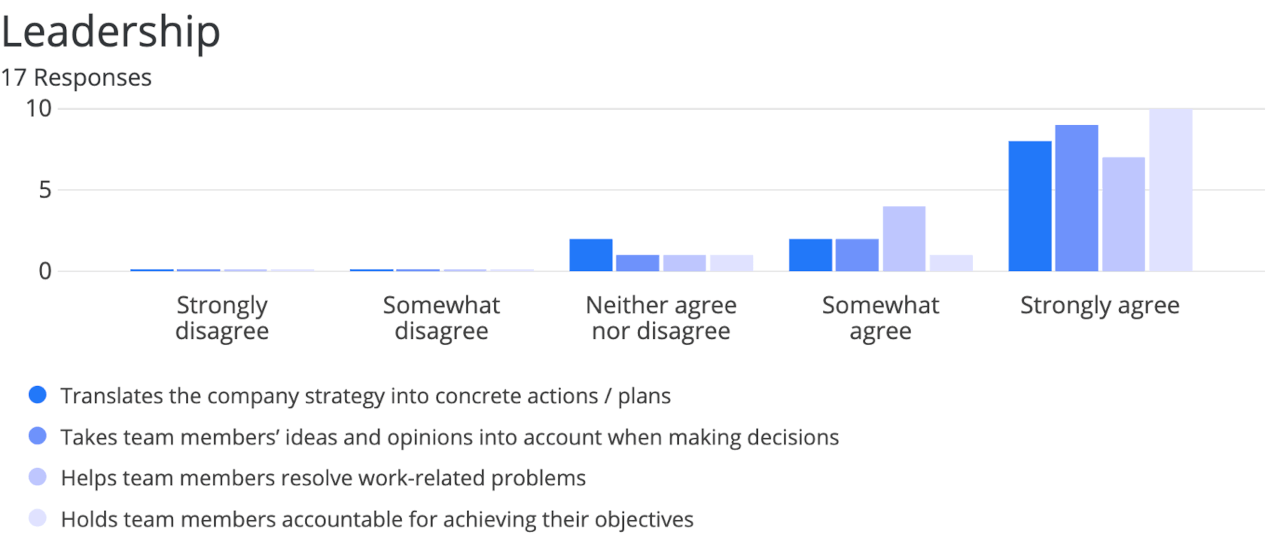
Tools: Livingcharts.com, Microsoft Excel, Google Sheets, Tableau, Power BI
Pie Charts
Pie charts are another popular visualization tool that can be used to show the distribution of responses to a particular question. They are particularly useful when you want to show the relative proportions of different categories or groups. However, it's important to note that pie charts can be difficult to read if there are too many categories.
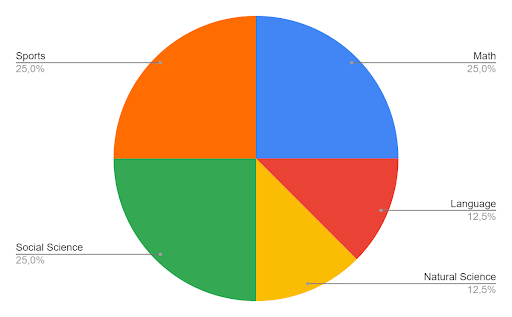
Tools: Microsoft Excel, Google Sheets, Tableau, Power BI
Line Charts
Line charts are ideal for showing trends over time. For example, a line chart can be used to show how the responses to a particular question have changed over time. Line charts are also useful for showing the relationship between two variables. For example, a line chart can be used to show how the level of employee satisfaction is related to the number of years they have worked at the company.

Tools: Microsoft Excel, Google Sheets, Tableau, Power BI
Scatter Plots
Scatter plots are a useful tool for showing the relationship between two variables. For example, a scatter plot can be used to show how the level of employee satisfaction is related to the number of hours worked per week. Scatter plots can also be used to identify outliers or unusual responses.
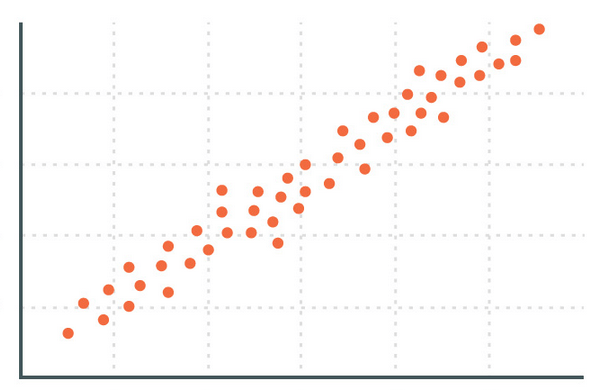
Tools: Microsoft Excel, Google Sheets, Tableau, Power BI
Heat Maps
Heat maps are a useful tool for visualizing survey data that is spatially distributed. For example, a heat map can be used to show the distribution of responses to a particular question across different regions or states. Heat maps are particularly useful when you want to show the relative density of responses in different areas.
Tools: Tableau, Power BI
Tree Maps
Tree maps are a useful tool for visualizing survey data that is hierarchical in nature. For example, a tree map can be used to show the distribution of responses to a particular question across different departments or divisions of a company. Tree maps are particularly useful when you want to show the relative size of different groups or categories.

Tools: Tableau, Power BI
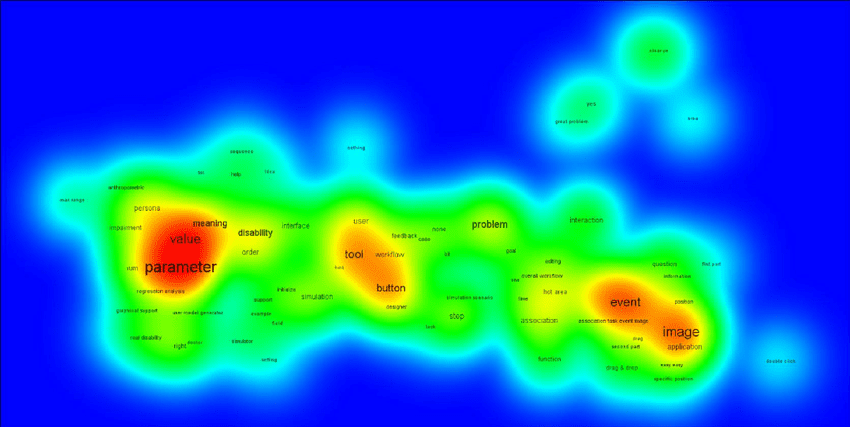
Word Clouds
Word clouds are a useful tool for visualizing survey data that is textual in nature. For example, a word cloud can be used to show the most common words or phrases used in response to a particular question. Word clouds are particularly useful when you want to identify the most common themes or topics in the responses.

Tools: WordClouds.com, Wordle.net, Tableau, Power BI
Effective visualization of survey data is critical to extracting valuable insights and communicating them to stakeholders. The visualization techniques and tools outlined above can help you create clear and compelling visualizations that will make your survey data more accessible and impactful.
Step 2 – Be Aware of the Volume of Data: 2 Best Types of Infographics for Different Amounts of Data
The type of infographic used for survey results can vary depending on the amount of data collected. Here are two examples of types of infographics for survey results based on the amount of data:
Infographics for Much Data - Heat Maps
Heat maps are a useful infographic for visualizing a large amount of data collected from a survey. Heat maps can display data using different color gradients that help to indicate patterns and trends. They are particularly effective for displaying data that is geographically based or involves complex categories.
For example, if a survey was conducted to gather information about public transportation usage across a city, a heat map can be used to display data such as the frequency of use, average travel time, or the most popular routes. This type of infographic can quickly and clearly communicate the most important findings of the survey.
Infographics for Little Data – Pictograms
Pictograms are a type of infographic that can be used when there is limited data available. They are visually appealing and can be used to communicate survey results in a fun and engaging way. Pictograms can be created using icons or symbols that represent the responses to different questions.
For example, if a survey was conducted to gather information about people's favorite fruits, a pictogram can be created that uses fruit icons to represent the percentage of people who chose each fruit. This type of infographic can be especially useful for presenting survey results to a general audience, as it is easy to understand and visually appealing.
Step 3 – Make Your Infographic Perfect: 7 Must-Haves
Designing survey result infographics can be a powerful way to convey important information in a visually appealing and easy-to-understand manner. The following tips will help you create effective infographics that clearly communicate your survey results.
Define Your Message
Before designing your infographic, it's important to define the key message or messages that you want to communicate. Identify the most important findings from your survey and consider how you can visually represent them. This will help you create a clear and focused infographic that conveys your message effectively.
Choose the Right Chart Types
The choice of chart types plays a crucial role in the effectiveness of your infographic. Consider the nature of your data and the message you want to convey to select the most appropriate chart types. For example, bar charts are ideal for comparing data, line charts are great for showing trends over time, and pie charts are useful for showing percentages.
Use Colors Strategically
Colors can help to make your infographic more visually appealing and easier to read. However, it's important to use them strategically. Choose a color scheme that is appropriate for your message and your audience. Limit the number of colors you use and ensure that they are easy to distinguish.
Keep It Simple
The purpose of an infographic is to communicate information quickly and clearly. Keep your design simple and avoid cluttering the infographic with unnecessary elements. Use concise and clear headings, labels, and captions. Use white space to create a clean and uncluttered design.
Use Icons and Images
Icons and images can help to make your infographic more engaging and visually appealing. They can also help to convey information quickly and effectively. However, it's important to choose icons and images that are relevant to your message and that are easy to understand.
Ensure Accessibility
When designing an infographic, it's important to ensure that it is accessible to everyone. Use alt text to describe images and graphs for those with visual impairments. Choose fonts that are easy to read and ensure that there is sufficient contrast between the text and background. Make sure that the infographic is compatible with assistive technologies such as screen readers.
Test Your Infographic
Before publishing your infographic, test it with a small group of people to ensure that it is easy to read and understand. Ask for feedback and make any necessary changes. This will help to ensure that your infographic is effective in communicating your message to your audience.
Designing an effective survey result infographic requires careful consideration of your message, your data, and your audience. By following these tips, you can create an engaging and informative infographic that effectively communicates your survey results.
Mini-FAQ To Reinforce Knowledge

How do you visually represent survey data?
The best visualization for survey data depends on the type of data being presented and the message that needs to be conveyed. Different visualizations can be used to highlight different aspects of the data and to make it more understandable to the audience. Here are some of the most effective visualizations for survey data:
- Bar/Line/Pie Chart
- Scatterplots
- Heatmaps
- Tree Maps
- Word Clouds
What Is the Best Visualization for Survey Data?
There is no single best solution.
Infographics for much data, such as survey results that involve a large amount of data, can benefit from the use of heat maps. Heat maps are a type of visualization that uses colors to represent data points, with different colors indicating different levels of intensity. Heat maps can be used to highlight patterns and trends in survey data that might otherwise be difficult to spot.
Infographics for little data, such as survey results that involve a limited amount of data, can benefit from the use of pictograms. Pictograms are a type of visual representation that uses images or icons to represent data points. Pictograms can be used to create a visually appealing and engaging infographic that is easy to understand and interpret.
What Is Survey Visualization?
Survey visualization refers to the use of visual tools and techniques to present and communicate survey data. Survey visualization is used to help people better understand survey results, by presenting complex data in an easily digestible format.
Survey visualization can take many forms, including charts, graphs, tables, and infographics. The choice of visualization technique will depend on the type of data being presented, as well as the message that the data is intended to convey. For example, a pie chart might be used to show the proportion of respondents who chose a particular response option, while a line graph might be used to show changes in respondent opinions over time.
The goal of survey visualization is to make survey data more accessible and understandable to a wider audience. Survey data can be complex, and it can be difficult for people to draw meaningful insights from the data when it is presented in a raw, unprocessed format. By using visualization techniques, survey results can be presented in a way that is more engaging, more easily understood, and more likely to be acted upon.
How Do You Graph Data from a Survey?
Graphing data from a survey involves selecting the appropriate type of graph or chart to represent the data and then plotting the data points on the graph. Here are the basic steps for graphing data from a survey:
- Choose the appropriate graph or chart
- Organize the data
- Assign values to data points
- Plot the data
- Analyze the results